Web browsers in 2020 can handle real-time audio workloads quite well. It’s not hard to be able to be around the 10 millisecond mark for round-trip latency 1 without any fear of glitches. While WASM is not as fast as the carefully optimized assembly code you often find in DSP routines, it can go a long way.
In a previous post, we discussed the Firefox Profiler and its presets, specifically how to profile a regular media workload (say, playing video and audio with high latency in the hundreds of milliseconds) and how easy it is to use and share profiles. An attentive reader may have noticed that the subject of low-latency real-time audio was not mentioned. This is because the Firefox Profiler is a statistical profiler. While perfectly adapted to most regular workloads, a statistical profiler falls short when profiling real-time workloads, where what matters is not the average of the speed of an operation, but rather the worst case scenario. 2.
This is a fairly long post, that starts with a bit of theory, explaining in more detail why the usual performance profiling tools are not enough. Then we’ll briefly chat about the previous version of the tools we had to measure real-time performance, and it’s newest incarnation, directly integrated in the Firefox Profiler. We’ll see that the Firefox Profiler is extensible via a custom Web Extension. A final discussion about the incompatibilities between statistical profiling and tracing in the current state of things conclude the post.
A short real-time audio performance assessment primer
In real-time audio programming in user programs, the model that is generally
used is a callback function, that is called with a buffer of n audio frames to
render, at a particular sample-rate. This callback is called over and over
again, each time the rest of the system needs more audio to output. It follows
that the only way to render the audio without missing a deadline is to render
the audio in less time that it takes to play it out. For example, in the Web
Audio API, and for now, audio is rendered in blocks of 128 frames. If the
AudioContext is running at 44100Hz, a block MUST be rendered in less than:
$$ \frac{128}{44100} \approx 0.0029s = 2.9ms $$
On top of this there is some processing done by the OS (mixing, possibly resampling, various other things) and the hardware, etc., but generally this is a reasonable target.
We can now compute a load value for a particular call of this callback: this represents the time it takes to render the audio when called back with a buffer of n frames, divided by the budget available to render it. If it takes one millisecond to render 128 frames of audio, our load a this point in time is around \( \frac{1}{3} \). We then have a time series for the load, and a time series with the same number of data point for the budget (the budget can be constant or variable for each callback, it depends on the platform). We now have two time series that allow us to derive a third time series:
$$ load[t] = \frac{render\ time[t]}{real\ time\ budget[t]} $$
A glitch happens when this load is over 1.0 (a bit less because the rest of the audio system needs some time as well). Because the audio system often has internal buffers, it might well not glitch each time the load crosses the 1.0 threshold: if a particular callback t has a load of 1.5, but the very next one has a load of 0.3, and if the system has internal buffers to smooth the load, the OS is going to absorb the load to a certain extent. Repeatedly crossing the 1.0 load mark will glitch for sure. Going over budget in a real-time audio system (and in general, any real-time system) is considered a critical failure of the system.
It follows that any operation that performs an aggregation on this computed time series will hide the truth. For example, getting the mean of the data is not useful: a mean is a low pass filter and will hide spikes, which is what is of interest here. A mean and its standard deviation is better (and is only really useful if the distribution has a normal distribution).
As often in statistics, having aggregate metrics is not enough. This is clearly and simply explained for example by the Anscombe’s quartet, where various aggregation functions are computed over four data sets, that are very different from each other, and the results of the aggregation functions are really similar.
What is really needed is all the data points to be able to understand what happened when things went over budget and fix it, and the actual distribution shape, to try to understand what happened in a particular scenario.
To illustrate this really important point, look at the following curve and histograms:
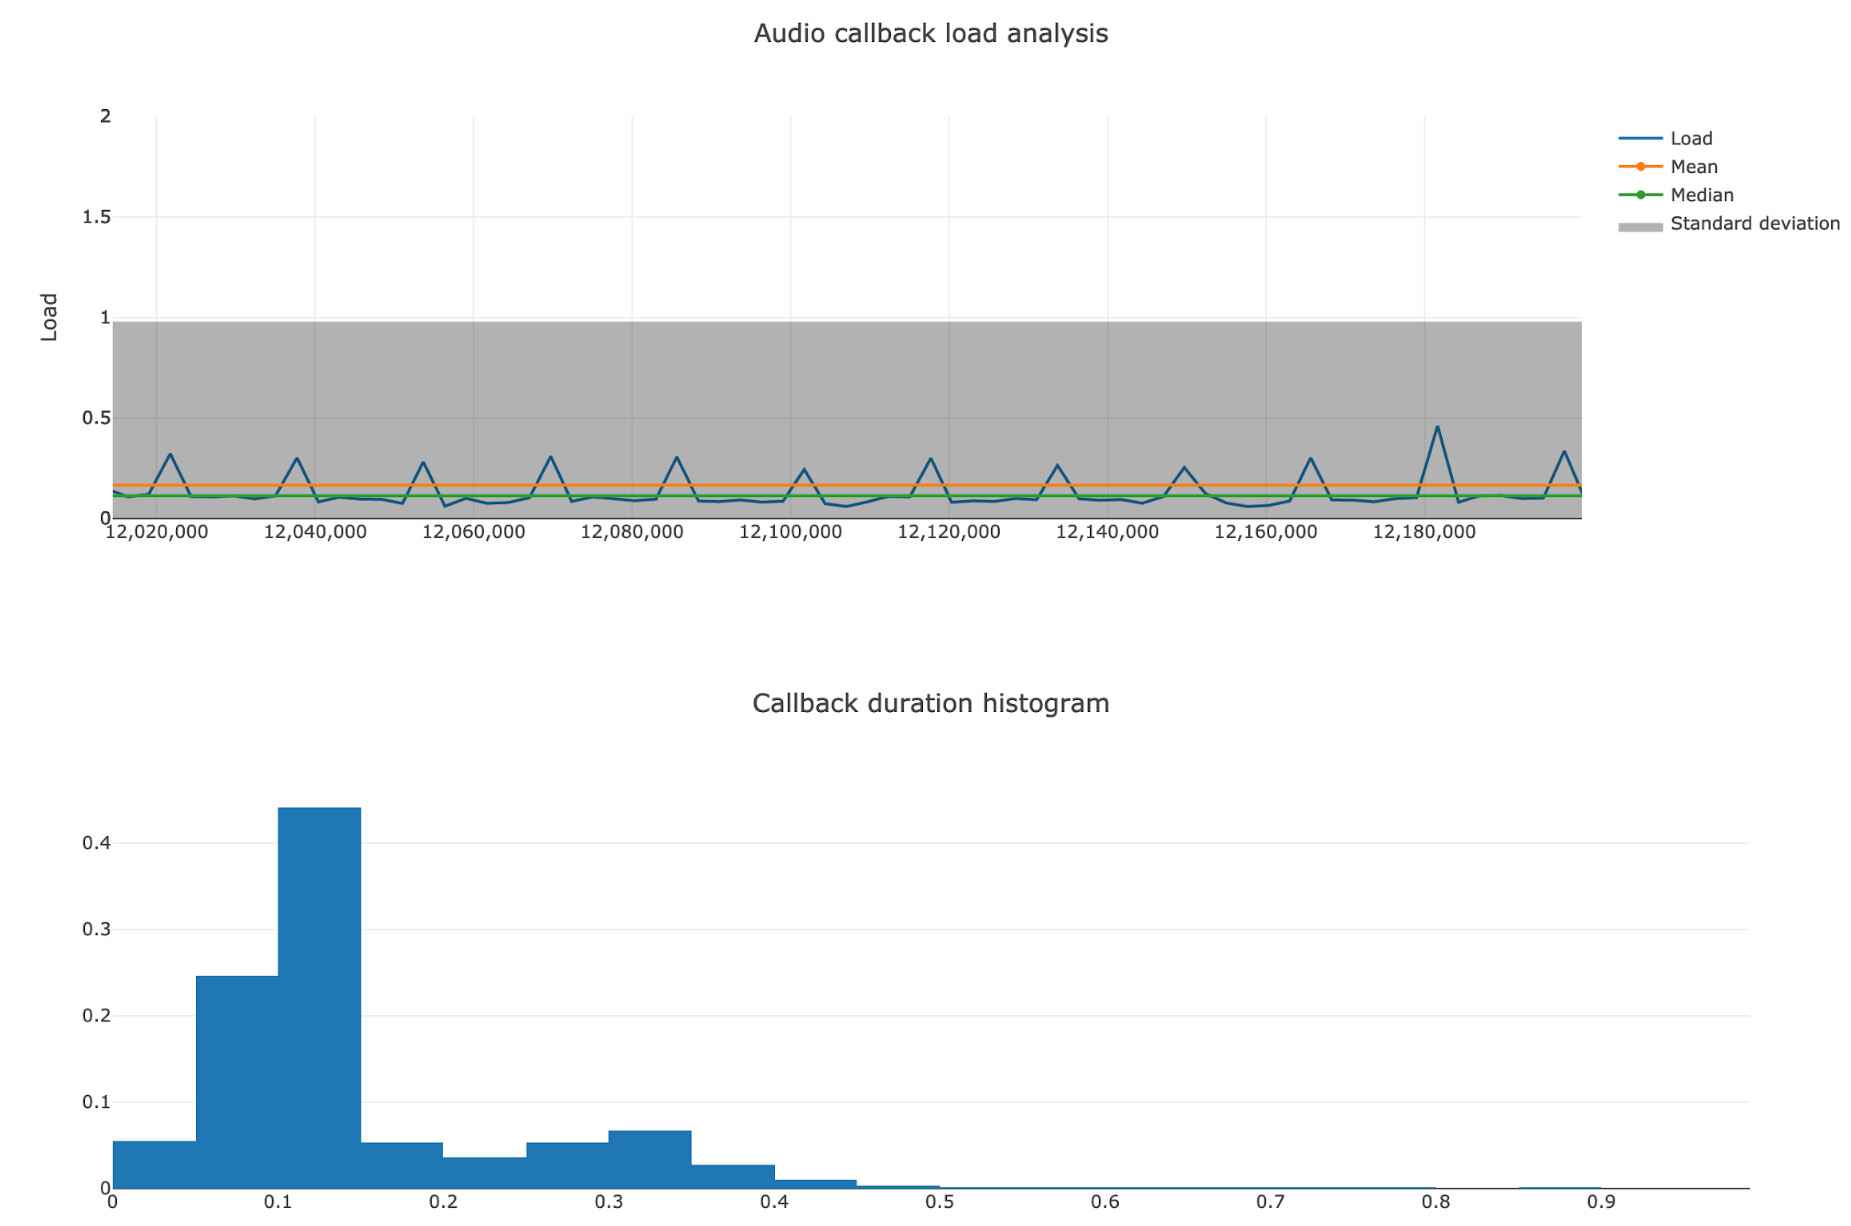
Real-life example of a bimodal distribution caused by sending back info from the audio callback thread, that renders at 300Hz to the main thread, that renders at 60Hz
The mean, the median, and the standard deviation don’t tell the truth. Maybe if we had the minimum and maximum values of the series, and a breakdown per percentile, it would have been possible to understand the trend. Plotting it immediately makes everything clear and allows spending more time fixing the problem instead of measuring and understanding the data.
The old solution, for Firefox developers
Being able to measure real-time callback time and understand why things don’t always take the same amount of time is extremely important when working on real-time systems. For Firefox, this was invaluable to diagnose WebRTC audio or video glitches. Browsers are made of lots of code, and it’s easy to do something without tracing down to the bottom of the call stack. It’s also possible to have a class or library change under you, and suddenly a lock is taken somewhere on the critical path, and once every few thousand callbacks, the deadline isn’t met, and a glitch or a frame drop occurs, and it’s hard to know why because it’s gone.
To solve those issues, I
implemented a simple
MPSC wait-free queue 3 a couple years ago. Now, any thread of interests post
structured messages containing measurements to an instance of this queue. This
is not an innovation by any mean, any big system must have a tracing system to
diagnose it 4, or diagnosing performance problems is a lost cause. This queue
is then be emptied regularly by a thread (every 10ms currently), and a
structured log file is written to disk, via MOZ_LOG, which is the logging
system of Firefox. The main purpose of this design is to move all the overhead
of the measurement, except the only part necessary, to a thread that sits idle.
In particular, here it means getting a time-stamp, getting the thread ID, and
appending to the queue.
The format used was the one that is overwhelmingly commonly picked by anybody
that doesn’t want to reinvent the wheel, called the “Trace event format”,
“systrace” or “the file format that can be loaded in Chrome when typing
chrome://tracing”. Its spec is
here.
It’s (simplifying) a massive but extremely simple JSON array. Loading it in
chrome://tracing allowed displaying it, it’s very nice.
Then I made a very small website (the image above is a screen-shot from that) that consumes the same format, and plot the load against time, carefully doing it in a way that spikes would be easy to find visually. By having the time values match between the tools, it is easy to find the problematic point in time using the graphical representation, and then one can drill down in the other tool. A histogram completes the visualization, because the shape of the distribution is often useful.
This system, while built quickly and by piling hacks on top of hacks, proved itself very useful over the years. Being able to run and measure the same scenario in two different version of Firefox, and see the improvement (for example) in terms of load and standard deviation of the load (the goal generally being to have less load and a tighter standard deviation) allow optimizing with confidence.
However, this system had numerous issues:
- It required disabling the sandbox, because the Firefox processes that run the web content can’t write to disk
- It required running Firefox with specific environment variables
- It allowed only one measurement per run
- The trace files themselves were quite big, uncompressed redundant JSON quickly pile up on the disk (it compressed extremely well of course, which was useful)
- If the traces were too big, no tool would accept the file, and we had to implement programs to filter the data to lower the size of the file
At the same time, AudioWorklet was shipping and would allow developers to
write arbitrary code on the real-time thread. Developers doing so immediately
wanted to assess the performance of their code, and we had no real answer
apart our hacky MOZ_LOG based tracing system.
But also at the same time, I became increasingly familiar with the Firefox Profiler, and its amazing UI.
The new solution
The Firefox Profiler (praised, in a previous post, and
probably in future posts) has a concept of markers, that are similar to the
previous’ format tracepoints, so I ported my
system to use the Firefox
Profiler Markers instead of MOZ_LOG. I kept the MPSC queue, because inserting
a marker is for the moment not real-time safe and quite expensive. The markers
code is in the process of being overhauled by the Firefox Profiler team, but I
needed this now to measure and optimize things today.
It works similarly as the solution described previously, except it’s now absolutely trivial to record a profile and upload it to Mozilla’s server and being able to share it with a simple URL: here is a video that shows, from a stock Firefox (Nightly for now), how to get a real-time trace of any Web Audio API app:
A quick description of what happens in the video:
- At 0:00, I start with an fresh Firefox Nightly, in which I’ve loaded a Web Audio API stress testing app, https://jackschaedler.github.io/karplus-stress-tester/.
- As usual, activating the Firefox Profiler is as simple as visiting https://profiler.firefox.com and clicking the button. At 0:04 we are all set up.
- At 0:07, I’m selecting the
Mediapreset, because I’m about to profile a real-time media workload. - At 0:12, I’m executing a scenario. This is a rather low load for the machine. The last section of this blog post explains why and how to profile higher load scenarios.
- At 0:18 I capture the profile. This opens a tab to display the profile. Shortly after, I close the tab I was profiling, because I don’t need it anymore.
- At 0:28 I play around in the interface, and by
zooming in, I can observe the audio callback budget, and how long our
computation has taken for each callback. In Firefox, the
DataCallbackis the audio callback that deal with input and output audio data and comes from the OS. There also is aStateCallbackthat is called when asynchronous operations are finished (stream start/stop/error, etc.).
A similar profile (captured from a macOS machine) is available
at https://share.firefox.dev/3gjwL6H for looking around.
The profiler’s marker UI is for now quite similar to other trace visualisation tool, except it’s currently per thread. It’s well-suited to look at data when zoomed in quite high on a particular portion of a trace, probably a point in time where something weird happened.
The problem is that finding an issue is not easy when you have that much data: 10 seconds of profiling is about 3000 rendered audio blocks. Zoomed out, it’s just a continuous blue line, so a graphical visualization is really needed, but probably too specific to be built-in the profiler.
The solution to the new problem
Chatting with the developers working on the profiler, they immediately mentioned
something that I found quite smart: the markers (and other data) are exposed as
a simple JavaScript array of objects, with all the data available to tinker
with, as an expando
property on window. Even cooler, if you select a particular time span, this
property, aptly called window.filteredMarkers is exactly that: the filtered
markers that correspond to what is on the screen.
Armed with some courage, knowing that I know nothing about this 5, I went ahead
and decided to write a Firefox extension that would read
those filteredMarkers and then I copy/pasted the previous hackish website’s
code into the extension, asked for help for the CSS bits, and voilà, I had the
best of all worlds:
- Real-time tracing of audio processing at the click of a button on a stock Firefox
- A very good UI to understand problems, and tracing that doesn’t aggregate the data
- Custom data visualisation that visually shows the data
- The ability to share profiles via a simple URL
Here is a short video showing it in action:
Here is a breakdown of what happens in this videos:
- At 0:00, I start with the profiler recorded above.
- At 0:10, I install my Web Extension for the Firefox Profiler. It is for now on a GitHub repo, and has been validated and signed by https://addons.mozilla.org (it wouldn’t install otherwise). This adds a little icon with a stopwatch where the hands have been replaces by an eighth note.
- At 0:31, when the thread
NativeAudioCallback(also calledAudioIPC0on some platforms) has been selected, I trigger the extension. This displays a couple metrics and the two graphical representations talked about previously. - At 0:43, I’m selecting a particular time region, I reselect the correct thread, trigger the extension again, and I see that the data is now computed from the selected time range.
Going further
By default, the Firefox profiler periodically collects the stacks for all threads that are being profiled. This is very useful for most workloads, but it’s sometimes problematic for real-time workloads.
Stack collection is done by pausing a thread and unwinding its stack, and then recording this stack information into a global buffer. This pauses and locks (in the current implementation), so isn’t suitable to assess performances of a system where any jitter is an integral part of the quality.
In the Media preset for the Firefox Profiler, stack sampling is running at 1000Hz (every millisecond) while the audio callback is running at around 300Hz as seen above (depending on the sample-rate). This means that each callback (on average), the thread is paused three times and a lock with a rather high contention is taken three time, a setup that is bound to fail for a real-time workload.
Thankfully, the Firefox Profiler allows disabling the stack collection, while still getting the markers for the threads:
- At 0:04 I show a little gymnastic that is useful: to
customize a preset, choose this preset and then switch to
Custom, this allows to use a particular preset as a template. - At 0:07, I disable a few features, and tick the
check-box labeled
No periodic sampling, that is pretty self-explanatory. - At 0:22, I close the tab and start a profile using
those
Customsettings.
This also happens to greatly decrease the size of the profile and allow recording traces for a very long time, which is sometimes essential to diagnose problems that happen rarely.
That said, statical sampling is extremely useful to quickly find spots to optimize: having it on by default, but being able to disable by simply un-ticking a check-box is very powerful. After finding a potential optimization candidate using statistical sampling, and writing the patch to make the code run faster, the performance comparison is best done by un-ticking the check-box and looking at the raw or aggregated data.
Conclusion
Tracing is a very powerful tool, and I’m glad the Firefox Profiler team is investing in making it better. I frequently use it to debug quality issues, or just regularly to see if the real-time threads of Firefox are not doing something they shouldn’t.
It’s now accessible to web developers, for example to A/B test between two implementation strategies, or to ensure a code changes that was intended as an optimization actually makes the code run faster. The current state of the extension is pretty rough, and patches are of course welcome. As often with open-source contributions, starting by opening an issue to discuss a non-trivial change is appreciated. When profiling, it’s always better to use a Firefox Nightly build: we’re constantly making improvements, any slowdown or problem you see in release might already be fixed.
I have plans to fix the fact that this measuring system is not really wait-free next, but if my measurements are correct (and I verified with a few different techniques, such as LTTng and eBPF), the data is consistent between the various tools, and the Firefox Profiler is vastly superior in terms of ease of use, and is cross-platform.
-
10 millisecond input-to-output is generally considered adequate for performing music or otherwise interact with a musical instruments although it depends on a variety of factor such as the type of instruments, the performer, the type of music being played, and a host of other details. To reach this, take any Firefox and have an OS that is suitable for music, such as macOS or a Linux Desktop with Jack, possibly with a dedicated sound card. Windows works well for music with ASIO drivers, but the license of the ASIO SDK would violate the SDK’s license and the MPL 2.0 so we can’t use it in Firefox.
IAudioClient3is promising but hasn’t been used successfully in browsers at the latency figures other platforms reach. ↩︎ -
This is a gross generalization. The classic article “Real-time programming 101: time waits for nothing” explains the problems and constraints in more details. ↩︎
-
I’m lying, this is not exactly correct, but it has been measured to be wait-free enough to be able to do its job in the type of scenario it’s being used for. It will be replaced by something proper in the long run, I knowingly made an engineering trade-off. ↩︎
-
chrome://tracing, Window’s ETW, Linux’sftrace, Tracy etc. are a few example of those systems, that are rather mature and industry standards. The Chrome team has very recently published an article about profiling Web Audio API workloads in Chrome. The tracing system in Chrome seems more mature and widely used by their developers than what we have in Firefox for now. ↩︎ -
As it turned out, Mozilla has a really good website that explain how to make extensions, https://extensionworkshop.com/, that had all the info I needed, and rather good tooling to get going in no time. As a system programmer that has learnt web technology by osmosis over the years, I was surprised at how fast it was to write a web extension that would take some data from the page and open an overlay to display the data differently. ↩︎